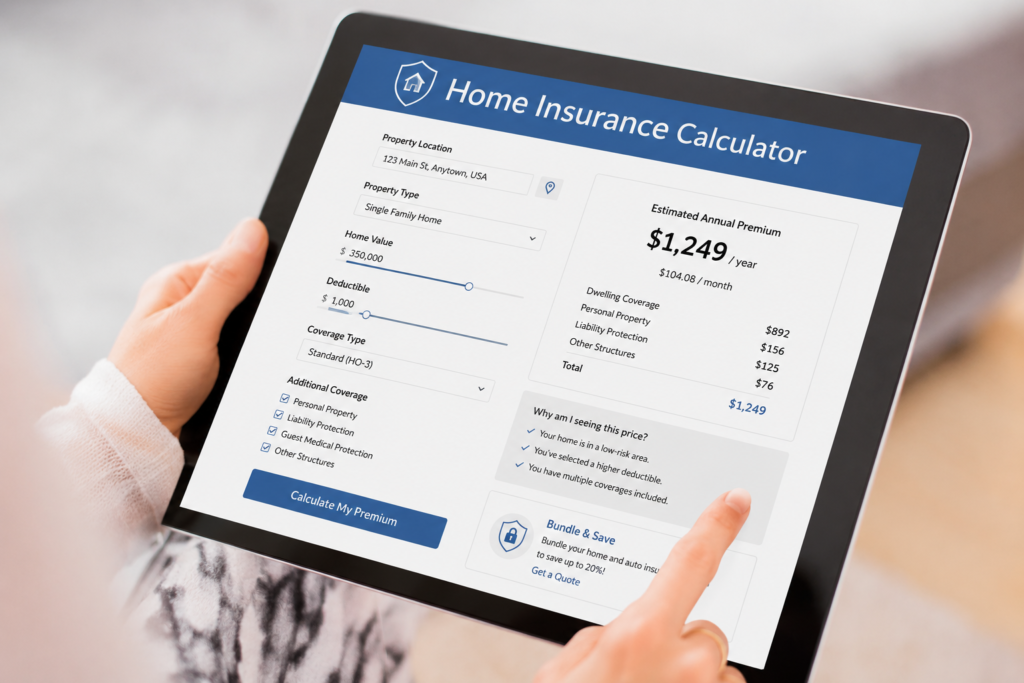
Home insurance calculator
Home Insurance Calculator: Know What You’ll Actually Pay Before an Agent Ever Calls You
Skip the lead-gen forms. Get a real, private estimate of your homeowners insurance premium in under a minute — no phone number required.
There’s a specific kind of dread that comes with buying home insurance. You fill out a form, and thirty seconds later your phone is ringing with a number you don’t recognize. You give up your email, and your inbox never quite recovers. Most “free calculators” online aren’t calculators at all — they’re lead forms wearing a calculator’s clothes, built to hand your contact details to whichever insurer bids highest for it.
This one is different. The home insurance calculator below runs entirely in your browser. Nothing you type is sent anywhere, sold to anyone, or used to trigger a sales call. Enter your numbers, get your estimate, and walk away with a real sense of what you should be paying — whether you use it to budget for a new home, sanity-check a quote you already received, or negotiate with your current insurer at renewal.
🏠 Your Home Insurance Calculator
Answer five quick questions. Your estimate updates instantly and never leaves your device.
This tool produces an educational estimate based on 2026 industry-wide rate patterns, not a quote from any specific insurer. Your actual premium depends on your carrier’s individual underwriting, your claims history, credit-based insurance score (where permitted), and your home’s exact rebuild cost. Use this number to budget and to compare — always confirm with a licensed quote before buying.
What “Average” Home Insurance Actually Costs in 2026
If you’ve searched this before, you’ve probably noticed something odd: every site quotes a different national average. One says $2,395. Another says $2,543. A third says $2,868. None of them are wrong — they’re just measuring different things, and almost nobody explains that clearly. Here’s the part competitors skip: the national average changes depending on how much dwelling coverage the analyst assumes. A study built on $300,000 in coverage will always report a lower number than one built on $400,000, even if the underlying rate data is identical.
So when someone tells you “the average home insurance costs $2,500 a year,” ask them: coverage on what, exactly? A $200,000 starter home and a $750,000 rebuild are never going to land on the same number, no matter what state either one sits in. That’s the entire reason a static “national average” is close to useless for your own budgeting — and exactly why the calculator above asks for your dwelling coverage first, not last.
Why Your State Matters More Than Almost Anything Else
Location is the single biggest lever on your premium — bigger than your credit score, bigger than your claims history, sometimes bigger than the age of your roof. The gap between the cheapest and most expensive states isn’t small. It’s over tenfold. A homeowner in Hawaii or Vermont pays a few hundred dollars a year for the same coverage that costs a homeowner in Florida or Oklahoma several thousand.
| Risk Tier | Example States | What Drives It |
|---|---|---|
| Highest risk | Florida, Louisiana, Oklahoma, Kansas, Nebraska | Hurricane exposure and, in Florida and Louisiana specifically, unusually high rates of insurance litigation |
| Elevated risk | Texas, Colorado, Arkansas, New Mexico, Mississippi | Tornado alley and hail-belt severe convective storms |
| Moderate risk | Missouri, Alabama, Michigan, the Dakotas, Georgia | Mixed severe-weather exposure, moderate rebuild costs |
| Lower risk | California, New York, Washington, New Jersey, Wisconsin | Lower catastrophe frequency, though wildfire zones within these states can spike locally |
| Lowest risk | Vermont, New Hampshire, Delaware, Maine, Hawaii | Minimal hurricane, tornado, and wildfire exposure |
How Much Dwelling Coverage Do You Actually Need?
This is the number that matters most, and it’s the one people get wrong in both directions. Dwelling coverage should reflect what it would cost to rebuild your house from the ground up — labor, materials, permits — not what you paid for it and not what Zillow says it’s worth. Market value includes the land underneath the house; rebuild cost doesn’t.
A reasonable starting formula: multiply your home’s square footage by your area’s local cost-per-square-foot to build. From there, the industry’s 80/20 rule applies — insure your home for at least 80% of its full replacement cost, or you risk a co-insurance penalty that reduces even a partial claim payout.
Coverage limits that typically follow your dwelling amount
| Coverage type | Typical limit |
|---|---|
| Other structures (fences, sheds, detached garage) | ~10% of dwelling coverage |
| Personal property (belongings) | ~50–70% of dwelling coverage |
| Loss of use (temporary housing after a claim) | ~20% of dwelling coverage |
| Personal liability | $100,000–$500,000, based on your net worth |
Six Ways to Lower the Number Without Cutting Coverage
Raise your deductible, deliberately. Moving from a $1,000 to a $2,500 deductible can shave 15–20% off your premium — worthwhile if you keep that difference sitting in savings rather than spending it.
Bundle your policies. Multi-policy discounts from pairing home and auto with the same carrier typically run 10–25%, and simplify claims to one relationship instead of two.
Shop before you renew, every single time. Loyalty is rarely rewarded in this market. Homeowners who compare quotes at renewal save meaningfully more, on average, than those who auto-renew year after year.
Harden the roof. An impact-resistant roof can unlock a 20–30% discount in hail-prone states, and in Florida a wind-mitigation inspection can be the difference between an affordable premium and losing coverage altogether.
Add monitored protection. Security systems, smoke detectors, and water-leak sensors each typically earn a small, stackable discount — 2–15% per device category, depending on the carrier.
Ask about your credit-based insurance score. Most states allow insurers to factor in credit history as a predictor of claims likelihood. If your credit has improved since your last renewal, ask your carrier to re-run your rate.
Frequently Asked Questions
Is a home insurance calculator the same as an actual quote?
No. A calculator gives you an educated estimate based on typical rate patterns for your coverage level, location, and risk profile. An actual quote comes from an insurer underwriting your specific home — your roof’s exact age, your claims history, and your credit-based insurance score all get factored in before a real number is issued.
Why did my home insurance estimate go up even though I didn’t file a claim?
Rebuilding costs have climbed sharply on labor and materials, and insurers reprice policies to keep pace with what a rebuild would actually cost today — regardless of your personal claims history.
Should I insure my home for its market value or its rebuild cost?
Rebuild cost. Market value includes the land, which doesn’t need to be insured because it can’t burn down or blow away. Insuring to market value routinely leads to over-paying for coverage you don’t need.
Does raising my deductible always save money?
It lowers your premium, but only makes financial sense if you genuinely have that deductible amount set aside. A lower premium that leaves you unable to cover a $2,500 deductible after a loss isn’t actually a discount — it’s a deferred bill.